

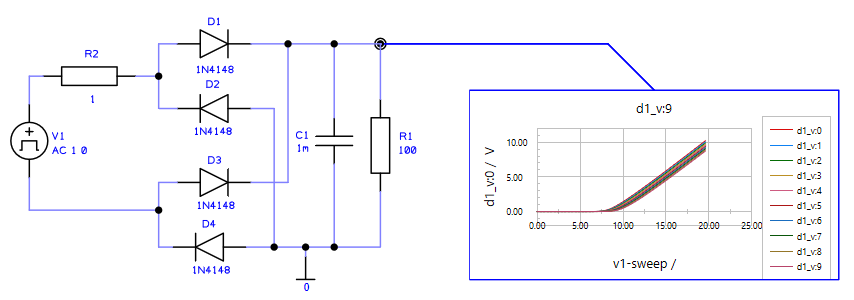
The Inserted Graph option is used to insert ‘local’ simulation graphs into a Schematic design to display simulation results. The graph is ‘hooked’ onto a net using a graph probe.
When a graph has been inserted into the design it will display simulation results if available.
Shortcuts
Default Keys: None
Default Menu: Insert
Command: Inserted Graph
Locating this option
Available from: Insert menu > Inserted Graph option
Available from: Simulation menu > Probes > Inserted Graph option
Using Inserted Graph
Add an Inserted Graph by selecting Inserted Graph from the Simulation menu and Probes. A graph probe will be on the end of your cursor ready for positioning. Select a net to attached it to. Once attached, the graph will now be available for positioning in your design. Once released, the graph will display simulation results. If no existing simulation results are available, run the simulator by pressing F9.
On initial insertion of the probe, you can also attach this to a component to display a graph of all the signals on that device.
Attaching a graph to the circuit
The ‘probe’ used to attached a graph will use the standard Part Graph Probe, the symbol of which can be edited to your requirement. If for some reason this Part is not found, it will default back to a Voltage Probe.
Detaching a Graph from the circuit
If you wish to move a graph from one net to another, simply select and drag the Graph Probe to the required net.
Removing a Graph
To remove a graph from the design, simply delete it using the Delete key.
Moving the Graph shape
The graph outline shape works the same as a regular shape. If you drag one side of the outline, when you release the mouse the shape releases.
Context menu options for the Graph
If you select one side of the graph, you will see the ‘shape’ context menu and options related to shapes.
If you select the whole graph shape or inside the shape on the graph, you can right click and select options from the context menu:
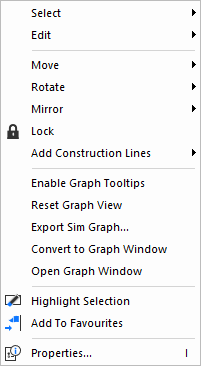
Enable Graph Tooltips - toggle the tooltip on or off within the graph.
Reset Graph View - once view has been changed on the graph, you can reset the view to its original status.
Export Sim Graph - export the graph image to a bitmap file. Choose the image size in pixels and the
filename.
Convert To Graph Window - switch to a full graph window view.
Open Graph Window to View - open a full graph window view in addition to the Inserted Graph.
Combining Graphs
If you wish to overlay two or more signals into one graph, drag a graph over another one, the one you wish to combine it into. Click the ‘host’ graph to complete the combining. You will now see two (or more) lines directing from the originating nets.
Selecting Labels and Colours within a Graph
The graph displays information that can be edited once the graph has been inserted. them.
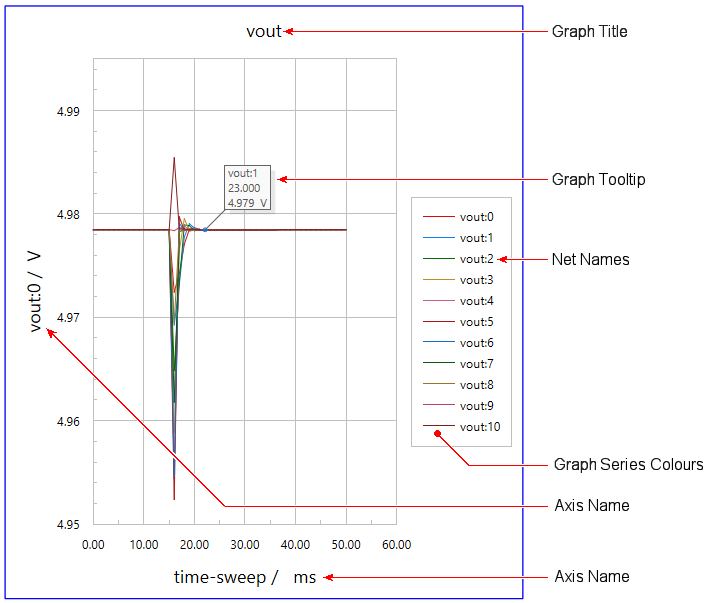
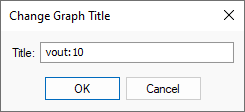
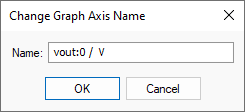
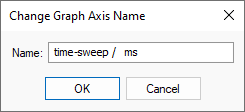
Graph Title, Axis Names, Net Name
Selecting the text of these labels displays a small dialog from where each label can be edited:
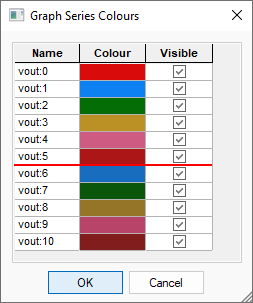
Graph Series Colours
Selecting the bar or text to the right of the graph displays a dialog from where the colour and visibility of nets displayed can be defined:
Related Topics
Properties - Inserted Graph | Design Settings - Inserted Graph | Workbook Mode | Spice Simulation