

Pulsonix integrates with Thermal Risk Management 3 (TRM3) by ADAM Research, a thermal and power distribution network analysis application.
This is a cost option, please contact your local reseller for more information.
TRM Bar
This modeless dialog is displayed as a configurable Dockable Window containing configuration options for Pulsonix integrations with TRM3.
This dock bar allows you to Export design data for TRM3 to analyse, and to Import analysis results to overlay them on a PCB design.
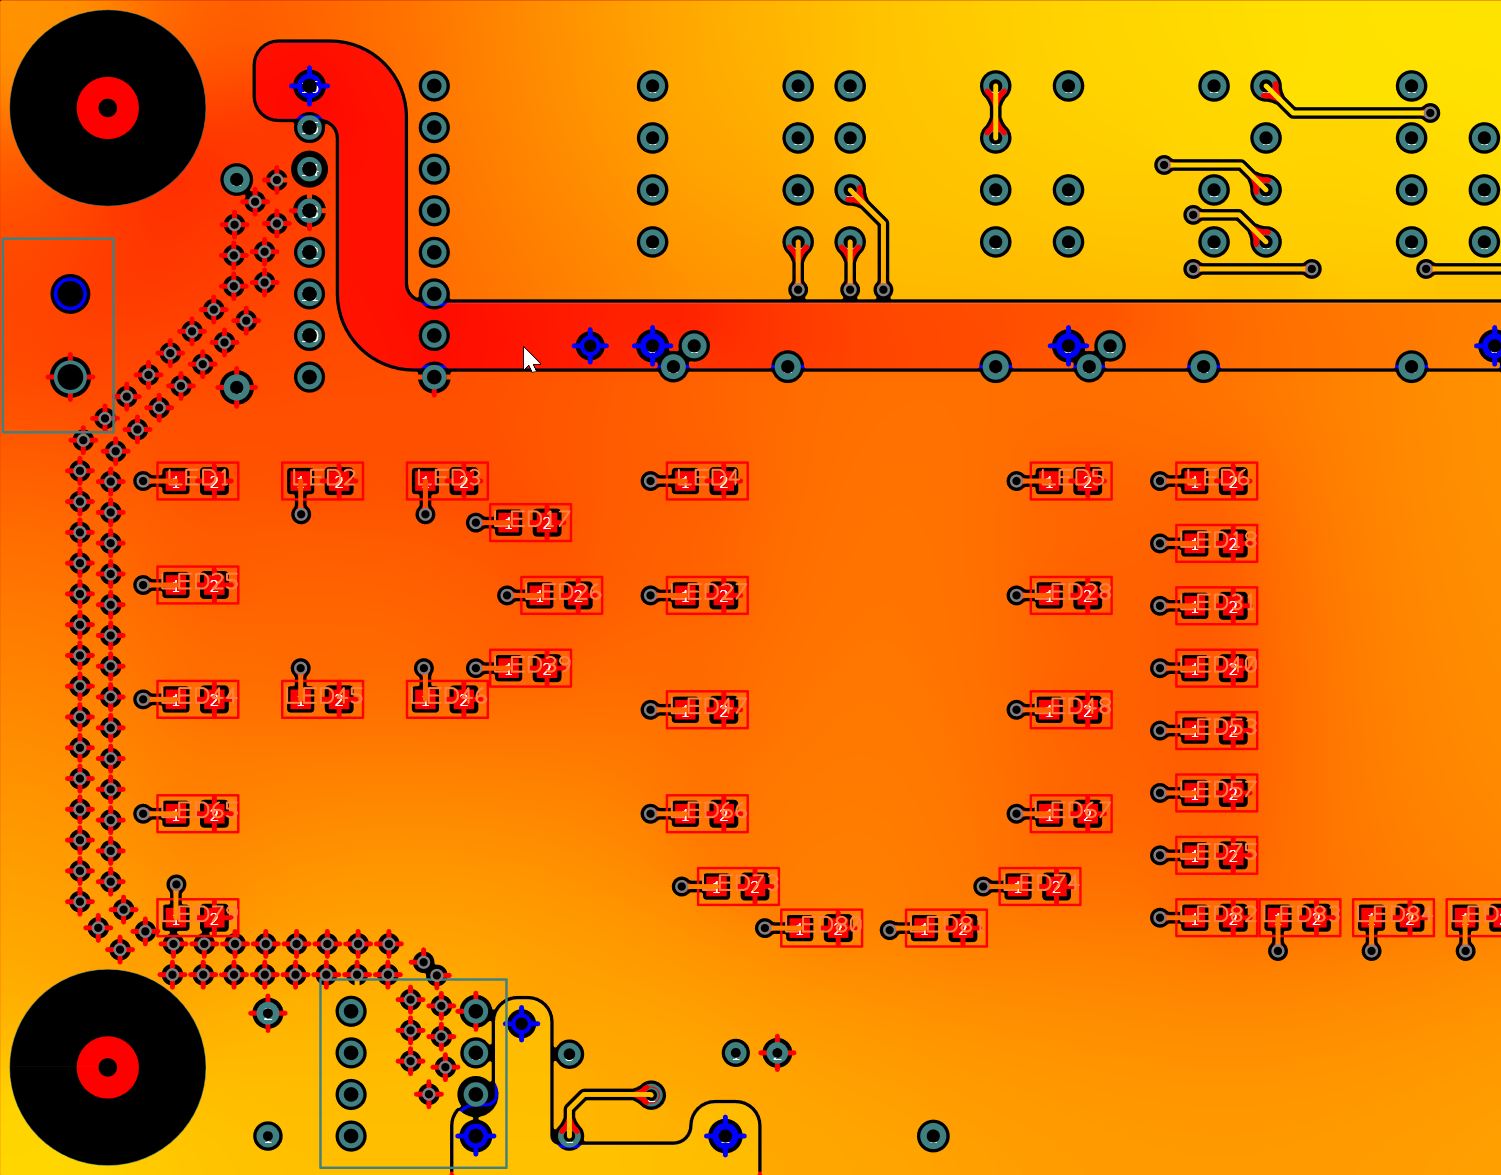
The image below illustrates how a simulated board might look once read back into Pulsonix:
Shortcuts
Default Keys: None
Default Menu: View
Command: TRM
Locating this option
Available from: View menu > TRM Bar
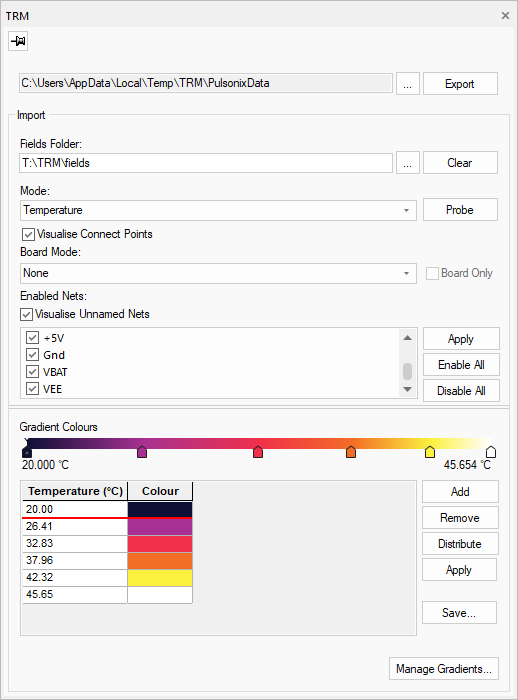
The TRM Bar Dialog
Export
Use the Export button to write a set of files that can be imported into TRM3 and analysed. The read-only edit field shows where data will be exported and cannot currently be changed; this folder is where TRM searches for the data. Selecting the button with the three dots next to the name will open an Explorer window at the folder location.
Design Attributes for TRM3
In order to reduce the time it takes to set up a working simulation in the TRM3 product, you can assign some special attributes to important Component and Component Pin items within the design that will then be imported into TRM3.
You can assign attributes to components on the Part in the Parts Library or locally in your design using Component Properties or by using the Attribute Editor.
For Components, the following attribute values will be imported into TRM3:
- TRM-POWER
- TRM-KW-BRD
- TRM-KW-AIR
- TRM-RJB
- TRM-RJT
For Component Pins, the following attribute values will be imported into TRM3:
- TRM-VALUE (suffixed with either ‘A’ or ‘a’ for amperes, or ‘V’ or ‘v’ for voltage)
Further details on the contents and intended use of these attributes can be found in the TRM3 documentation.
Thermal Simulation using TRM
Once the TRM folder has been written, it is ready for imported and analysed in TRM3, which must be done externally to Pulsonix. Running TRM3 simulations will produce output files which can be read by Pulsonix and used to produce data overlays.
Import
To see the data exported by TRM overlaid on your design, you must first enable Hardware Acceleration in Display Options. Overlays will only be visible when Hardware Acceleration is set to options 3, 4 or 5.
To import TRM analysis data for a design, select a Fields Folder using the button with the three dots next to the name. The fields folder is part of TRM’s output report and contains one “input.txt” file and several “.xyz” files. The data imported is referred to as “fields” and is usually contained in a “fields” folder.
You can then press the Import button to load the data to your design. On successful import, the button will change to Clear, which allows you to remove the data so that you can load a new set. Data will be removed when you close or Re-open the design.
Mode
The Mode combo box allows a choice of which field data set from the analysis results will be overlaid on the design. The modes are directly related to those within the TRM3 product.
The modes available correspond to the different TRM field types:
- Current
- Electrical Conductivity
- Heat
- Temperature
- Thermal Conductivity
- Voltage
- You can also choose No Mode to disable visualisation.
When any mode other than No Mode is selected, copper shapes and tracks will be drawn based on TRM import data, using your net and gradient preferences. Selecting an item will cause it to be drawn in the typical selection style.
Probe
Pressing the Probe button will start a probing mode, which will display a tooltip that contains field data about the item that your mouse pointer is hovering on. This data includes:
- The data reading, depending on the current mode.
- The net of the item being inspected, if there is one.
- The name or type of the item being inspected.
- Which layer is being inspected for a reading.
Pad and via visualisation
If the Visualise Connect Points option is enabled, connection points such as pads and vias will be drawn using field data. Otherwise, they will be drawn in their typical pad style.
The layer sampled when visualising and probing connection points depends on which layers are enabled and have fields associated with them, so enabling and disabling layers can be used to change the visualisation. The layer used is the first visible layer included in a connection point layer span which has associated data.
Board visualisation
You can choose from one of four different board modes:
- No Mode - Boards will be drawn in their typical style.
- Electrical - Boards will be filled with field data associated with the top-most visible electrical layer.
- Below Electrical - Boards will be filled with field data for the first construction layer which is below the top-most visible electrical layer.
- Above Electrical - Boards will be filled with the field data for the first layer which is on top of the top-most visible electrical layer.
If the Board Only option is enabled, copper shapes, tracks and connection points will not be drawn using field data.
These modes can be used to view field data for layers which are not visible on the design, such as construction layers.
The board fill is a visual effect only - it is not possible to probe the board in these filled areas.
Enabled Nets
The Enabled Nets section contains a list box which allows you to select which nets will have data overlays enabled. These selections are individual to each mode. By default, nets will be enabled for all modes.
The Enable All and Disable All buttons can be used to quickly change net selections for a mode. These options are also available in the context menu on the list box.
The preferences in the list box will not be applied unless Apply is pressed.
If the Visualise Unnamed Nets option is enabled, visualisation will be enabled on items with no net defined. This setting is not mode-specific.
Gradient
The Gradient section lets you manage how the overlay will be displayed. These settings are individual to each mode.
When importing a design for the first time, the gradient will be mapped to the minimum and maximum values for each data field.
Use the Add and Remove buttons to add and remove Gradient Stops to a gradient. The gradient used will smoothly transition between these stops. Use the Value and Colour fields in the grid to manage Gradient Stop positions and colours. Pressing the Distribute button will change the values of the current gradient stops to be within the range of the currently selected field data.
To update the visualisation based on the selected gradient, press Apply. Use the Save button to save the current gradient as a preset.
The Manage Gradients button opens a dialog which you can use to manage preset gradients that are specific to your user configuration.
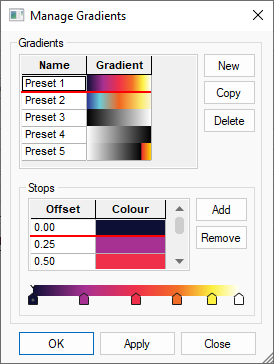
Manage Gradients Dialog
This dialog useful for creating named gradient presets that can be loaded and used across multiple designs. The default presets are based on the gradients used in thermal imaging.
Values in this dialog are between 0.0 and 1.0, which represent the minimum and the maximum values in a TRM data set.
The New buttons allows you to create a new named gradient preset, which can be edited in the Stops section of the dialog using the Add and Remove buttons and the grid.
The Load button will copy the current gradient selection into your current TRM configuration, automatically mapping gradient values to your current data set. Press Apply in the dock bar to update the overlay with these changes.
Use the Delete button to remove presets from the list.
Press Apply to save these changes to your presets and OK to apply and close the dialog.
Exporting Results Images
If you wish to export the overlay results at any point, use the Capture Window option from the Edit menu. The results can then be pasted into your document.