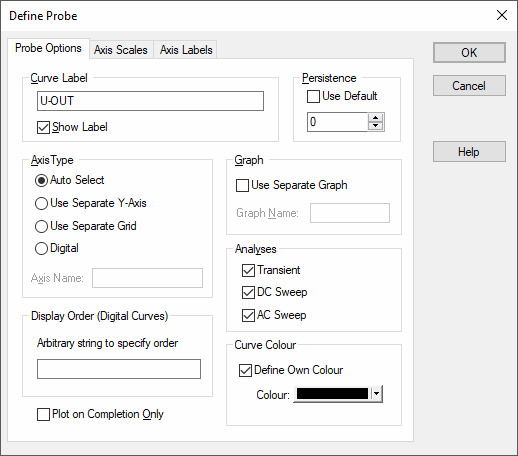
This page can be found on the Define Probe dialog.
Fixed probes have a wide range of options allowing you to customise how you want the graph plotted.
Shortcuts
Default Keys: F7
Default Menu: Simulation
Command: Edit Spice Value/Model
How To Change Probe Options
Use the Define Probe dialog to edit a fixed probe. Click on the Options tab.
The following dialog will be displayed:

Curve Label
Text that will be displayed by the probe on the schematic and will also be used to label resulting curves.
Persistence
If Use Default is checked, the value used will be the value set in the simulator’s general options. To set this in the simulator, use the File menu and then select Options and General to display the Options dialog. In this dialog choose the Graph/Probe/Data Analysis tab. Set the Default Persistence to the desired value.
If not using the default, set the persistence value that is required. A non-zero value means curves created from the probe will have a limited lifetime. The persistence value is the number of curves from a single probe that will be displayed at once, the oldest being automatically deleted. If set to zero, they will never be deleted.
Axis Type
Specifies the type of y-axis to use for the curve.
Auto Select
Will use main y-axis unless its units are incompatible. E.g. plotting a current but the graph already has a voltage. In that case, a new y-axis will be created alongside the main one. If the signal is digital, a digital axis (see below) will be used for this probe.
Use Separate Y-axis
Will always use its own separate y-axis. If you specify this you can optionally supply an Axis Name. The value of the axis name is arbitrary and is used to identify the axis so that multiple fixed probes can specify the same one. This name is not used as a label for display purposes but simply as a means of identification. Axes can be labelled using the Axis Labels dialog page.
Use Separate Grid
Similar to above but uses a new grid that is stacked on top of main grid.
Digital
Use a digital axis. Digital axes are placed at the top of the window and are stacked. Each one may only take a single curve. As their name suggests, they are intended for digital traces but can be used for analog signals if required.
Graph
Check Use Separate Graph if you wish a new graph sheet to be used for the probe. You may also supply a graph name. This works in the same way as Axis Name (see above). It is not a label but a means of identification. Any other probes using the same graph name will have their curves directed to the same graph sheet.
Analyses
Specifies for which analyses the probe is enabled. Note, other analysis modes such as noise and sensitivity are not included because these do not support schematic cross probing of current or voltage.
Display Order
Enter a string to control display order for digital curves. Normally digital curves are ordered according to their title. The value supplied here will be used instead if not empty. To force the curve to be placed above other curves that do not use this value, prefix the name with ”!“. The ”!” character has a low ASCII value. Conversely, use ”~” to force curve to be displayed after other curves.
Curve Colour
If Define Own Colour is checked, press the colour button to select a colour of your choice. In this case the curve will always have the chosen colour.
Alternatively, leave Define Own Colour unchecked for the curve colour to be chosen automatically in a manner that tries to minimise duplicate colours on the same graph.
Plot on Completion Only
If checked the curve will not be created until the analysis is finished. Otherwise they will be updated at an interval specified in the Simulator’s Options dialog.
Editing Multiple Probes
If any of the fields are displayed as
The same applies to Radio Buttons, where no button being set indicates the probes have different values for this field.