After Simulation has been run, use this interactive tool to plot the voltage and current on selected nets and device pins in the design.
The alternative approach is to use Insert Fixed Probe from the Simulation menu to add fixed voltage or current probes to the schematic design before simulation. The Pulsonix-Spice Simulator will then generate graphs of the probed voltages and currents automatically when simulation is run.
Shortcuts
Default Keys: None
Default Menu: Simulation
Command: Random Probe
How To Use A Random Probe
After running simulation, select the Random Probe option from the Simulation menu.
A probe cursor will appear indicating that you are using the interactive Random Probe tool. The current probe type is displayed on the right hand side of the Status Bar. It will be the same type as was last used in this option.
A prompt stating what type of item you can pick is displayed on the left hand side of the Status Bar. As you move the cursor over the design, nets and pins that are suitable for probing with the current probe type are highlighted.
Left click on the highlighted item that you wish to probe to tell the simulator to display the plot of the voltage or current on the picked item.
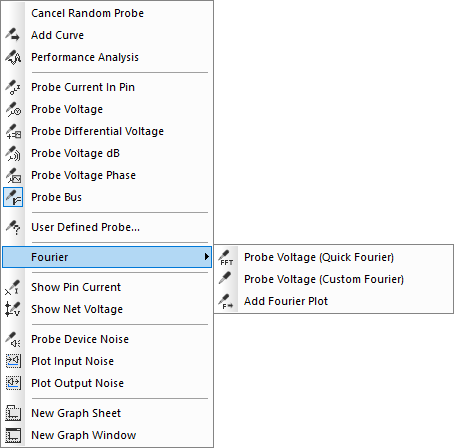
Right click to use the shortcut menu to change the type of probe you are using. The following menu will be displayed:

Each section on the menu contains a different type of probe as follows.
Add Curve
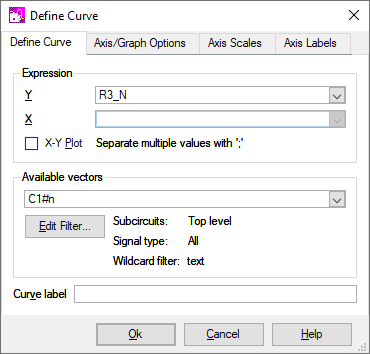
Use this random probe type as a method of cross probing to the Simulator’s Define Curve dialog. This enables you to plot arithmetic expressions of any number of voltages and/or currents, to plot the power of a device for example.

This is a Simulator dialog, and is displayed after choosing the Add Curve probe type and picking a pin or net. The picked pin or net name is displayed in the Expression field.
Subsequent nets and pins picked will also have their names sent to the Expression field. Alternatively you can choose the net and pin names to use from the dialog Available Vectors list.
For more information on how to use the Define Curve dialog, use the Pulsonix-Spice Simulator’s help topics.
Performance Analysis
Use this random probe type as a method of cross probing to the Simulator’s Define Performance Analysis dialog.
When running multi-step analyses which generate multiple curves, it is often useful to be able to plot some characteristic of each curve against the stepped value. For example, suppose you wished to investigate the load response of a power supply circuit and wanted to plot the fall in output voltage versus the transient current load. To do this you would set up a transient analysis to repeat a number of times with a varying load current. (See Multi-Step Analyses). After the run is complete you can plot a complete set of curves, take cursor measurements and manually produce a plot of voltage drop versus the load current. This is of course is quite a time consuming and error prone activity.
Pulsonix-Spice has a means of automating this procedure using the Performance Analysis dialog. A range of functions, sometimes known as “goal functions”, are available that perform a computation on a complete curve to create a single value. By applying one or a combination of these functions on the results of a multi- step analysis, a curve of the goal function versus the stepped variable may be created.

This is a Pulsonix-Spice Simulator dialog, and is displayed after choosing the Performance Analysis probe type and picking a pin or net. The picked pin or net name is displayed in the Expression field.
Subsequent nets and pins picked will also have their names sent to the Expression field. Alternatively you can choose the net and pin names to use from the dialog Available Vectors list.
For more information on how to use the Performance Analysis dialog, use the Pulsonix-Spice Simulator’s help topics.
Standard Probe Types
The next shortcut menu section contains six of the standard probe types that match the fixed probes that can be added to the design. Pick nets when using the Voltage probes, device pins when using the Current probes, and bus segments when using the Bus probe.
The Differential Voltage probe asks for you to select two nets before plotting the simulation curve.
The Bus probe will display a dialog to create a plot representing all the signals on the picked bus. It is possible to probe a bus as long as it is a closed bus and all the signals on the bus are digital. See Define Bus Probe for more details.
User Defined Probe
Use this option to display a dialog allowing you to choose your own probe type (Voltage, Current, Differential Voltage etc) and probe function (Phase, FFT, Nyquist etc).
For more information on this see the Define Random Probe dialog.
Fourier
A Fourier spectrum of a signal can be obtained in a number of ways. Use the Fourier option on the shortcut menu to present a sub menu containing three options. You have a choice of using the default settings for the calculation of the Fourier spectrum or you can customise the settings for each plot.
Use Probe Voltage (Quick Fourier) to perform a Fourier plot on the picked net using the default settings.
- Method - Interpolated FFT.
- Number of points - Next integral power of two larger than number of points in signal.
- Interpolation order - 2.
- Span - All data.
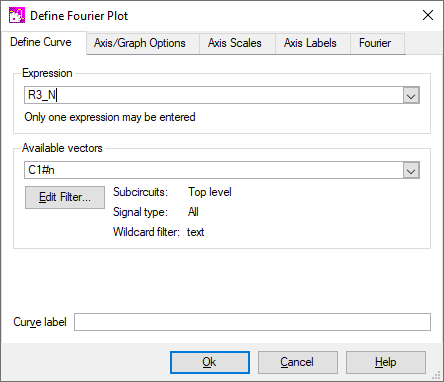
Use Probe Voltage (Custom Fourier) to present the following Define Fourier Plot dialog after a net is picked to allow you to customise some of the settings.

For more information on how to use this dialog, use the Pulsonix-Spice Simulator’s help topics.
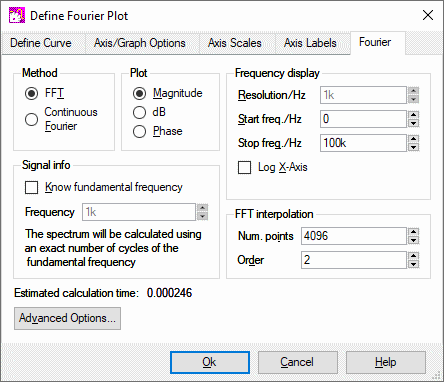
Use the Add Fourier Plot option from the Fourier menu to display the Define Curve dialog, mentioned in the Add Curve option above. It will contain an additional Fourier tab with the Fourier settings shown in the previous Probe Voltage (Custom Fourier) option.
This allows you to use the Define Curve tab to plot the Fourier spectrum for arithmetic expressions of any number of voltages and/or currents.
Show Pin Current and Show Net Current
These options display the results of a DC operating point analysis in the form of the voltage value on picked nets and current value on picked pins. The value is displayed in the Simulator Command Shell window.
The DC operating point analysis voltage values can be displayed in the design using Bias Voltage Markers.
Plotting Noise Results
These three probes are only relevant after performing a Noise Analysis. Selecting Plot Input Noise and Plot Output Noise directly plot the results of the noise analysis without any further interaction.
Using Probe Device Noise prompts you to select a device for which you wish to plot the noise generated.
An error will be displayed if a “quiet” device is probed. A “quiet” device is one that does not have noise generating elements e.g capacitors and inductors are quiet. Also subcircuits do not give a noise result.
New Graph Sheet and New Graph Window
Use these options whilst probing to choose where the next curve will be plotted.
Normally, if there are no graph windows open, one will be created. If a graph window is open and the currently displayed sheet has a compatible x-axis to what you are probing, the new curve will be added to that sheet. E.g. if the currently displayed graph is from a transient analysis and has an x-axis of “Time”, and you are also probing the results of a transient analysis , then the new curve will be added to the displayed graph. If, however the displayed curve was from an AC analysis, its x-axis would be frequency which is incompatible. In this case a new graph sheet will be created for the new curve.
Use the New Graph Sheet command to force a fresh graph sheet in the Simulator’s current graph window, or use the New Graph Window command to force a completely new graph window.
Related Topics
Bias Voltage Markers | Define Bus Probe | Define Random Probe | Multi-Step Analyses | Noise Analysis